VETTAM Test Simulations
Below are some movies of some tests performed in the VETTAM Method Paper. Please refer to the paper for a full description of the tests and the initial conditions.
Transport of Gaussian pulse in the streaming, static and dynamic diffusion regimes
This test demonstrates that VETTAM can handle *all asymptotic limits of radiation hydrodynamics. It shows the propogation of a Gaussian pulse of radiation energy in optically thin/streaming conditions (left), in moderately optically thick/static diffusion conditions (middle), and in extremely optically thick/dynamic diffusion regime (right). Different linestyles denote different grid resolutions and the purple dashed lines shows the analytical solution. This test is described in Section 3.1 of our paper.
Infrared radiation-pressure driven shell expansion
Animation showing the evolution of the projected gas density for the thin shell expansion test in Section 3.7 of our paper. There is a source of (IR) radiation at the centre, and a dusty shell at t = 0. The IR photons scatter through the shell and drive the expansion of the shell in very good agreement with analytical predictions. We also use AMR for this test, where we focus the resolution on the thin shell; the movie shows the block structure of the grid.
Shadow cast by two point sources of radiation: Comparison of different closures
The animation below shows the evolution of gas temperature as two point-like sources of light impinges on a dense spherical blob of gas. The evolution obtained with VETTAM (right panel) is compared with that obtained with more commonly used, but less accurate closures such as FLD and M1. This is the test described in Section 3.8.2 of our paper. We can see that VETTAM produces the right solution for this scenario, whereas the other closures fail to do so.
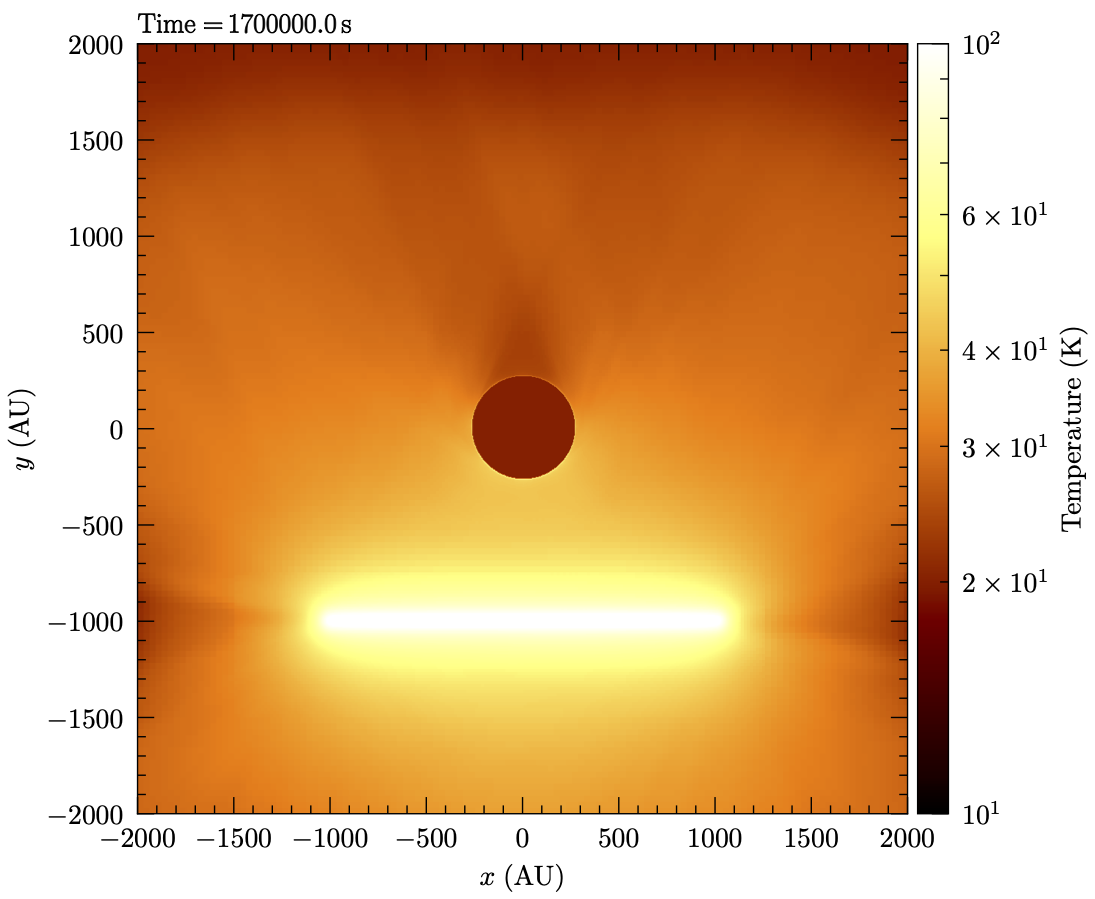
Shadow cast by an extended diffuse source of radiation
The animation below shows the evolution of gas temperature as an extended hot source at the bottom of the domain impinges on a dense spherical blob of gas at the top of the domain. This is the test described in Section 3.8.3 of our paper. We can see that VETTAM produces that seem qualitatively correct for the given distribution.
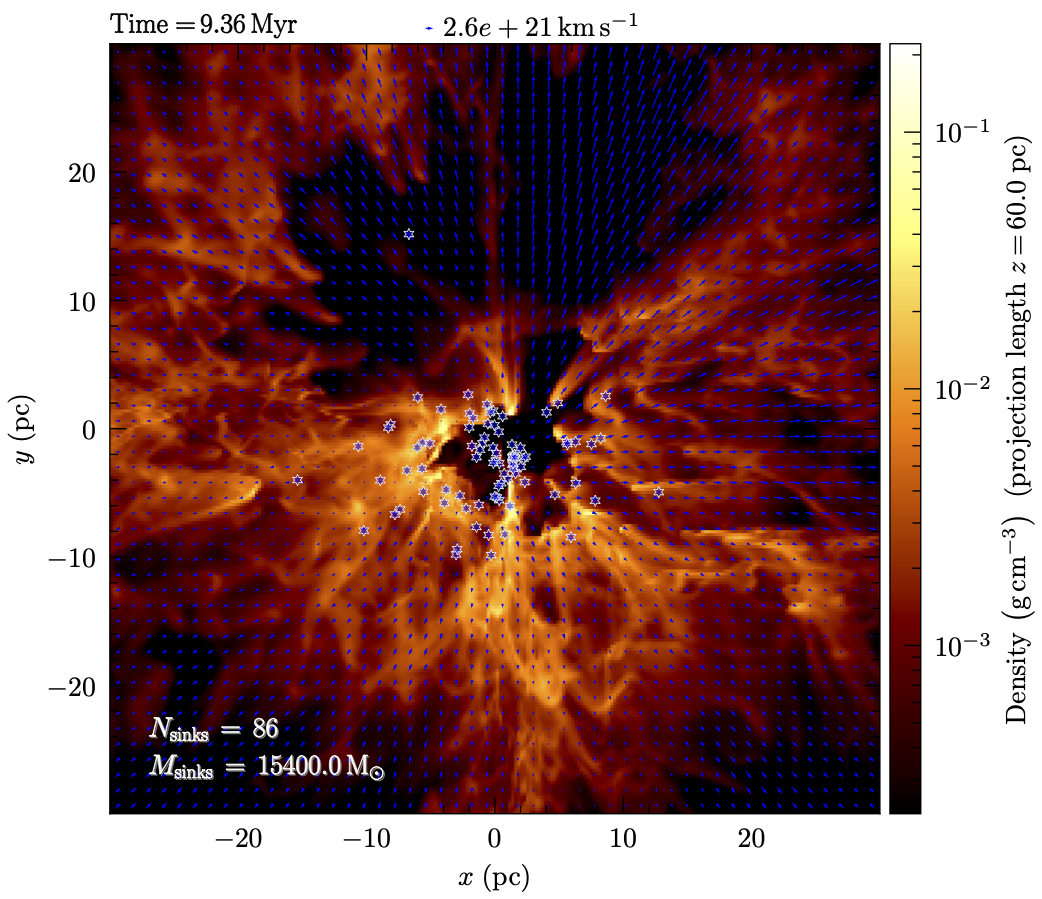
RHD Simulations of Super Star Cluster Formation
Gas Evolution
Simulations from Menon+ 2022c showing the evolution of the projected gas density under the effects of UV+IR radiation pressure, for four different initial gas surface densities (increasing top-left to bottom-right).
UV vs IR
Comparing the evolution of gas for control simulations with only the radiation pressure in the IR band (left), and with the combined effects of UV and IR radiation bands (right).
Dust-to-gas ratios
Simulations from Menon+ 2022b showing the evolution of the projected gas density, compared for dust to gas ratios of 1, 2 and 3 times solar respectively (left to right). We can see that even at high dust-to-gas ratios, the effects of IR radiation on the dynamics are mild.
IR dust opacities
Movies of simulations for our fiducial run in Menon+ 2022b with realistic dust opacities of Semenov et al. 2003 (left) used in our simulation setup. This is compared with control runs that adopt a power-law approximation to the same (middle), and a run with a constant dust opacity of 10 cm^2 g^-1 (right): both of which are commonly used approximations in the literature. The difference in dynamical outcomes shows why using the dust IR opacities consistent with the state of the gas are important.
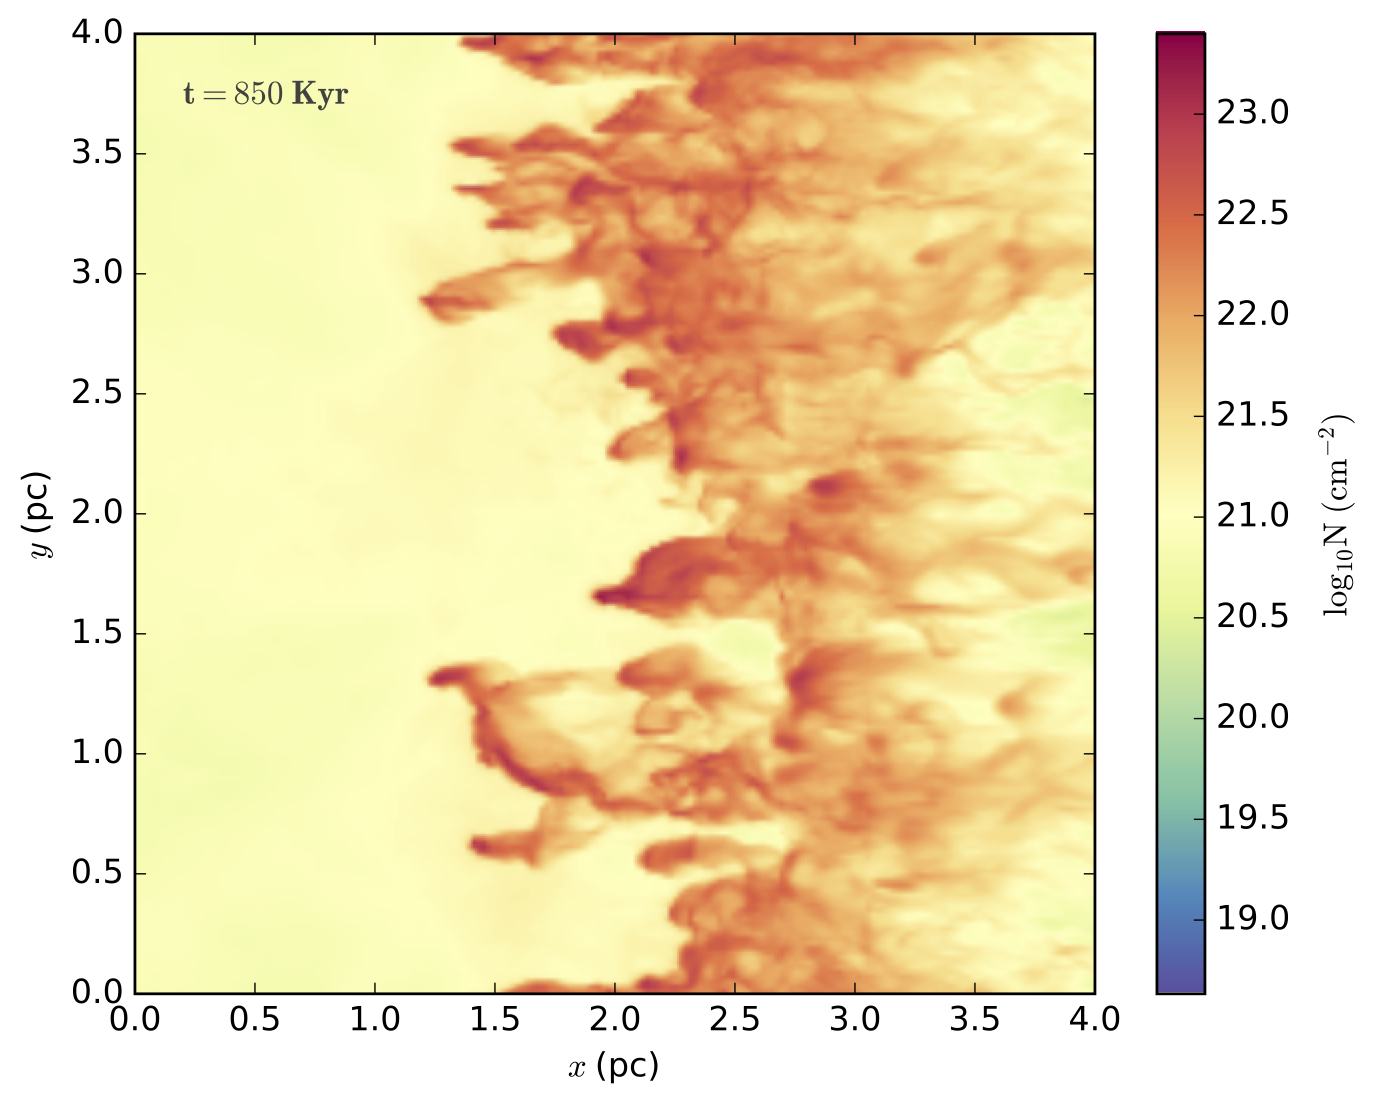
Interaction of ionising radiation with the turbulent ISM
Simulations from Menon, Federrath & Kuiper 2020 of a turbulent cloud impinged by a plane-parallel front of ionising radiation coming in from the left boundary. The movie shows the line-of-sight column density of the gas perpendicular (left) and parallel (right) to the direction of the incoming radiation front. The radiation ionises the low-density gas/voids in the turbulent cloud, heating that gas to 10000 K, whose increased thermal pressure compresses the overdensities that are still neutral. This produces pillar-like neutral gas structures, reminiscent of the famous “Pillars of Creation”.